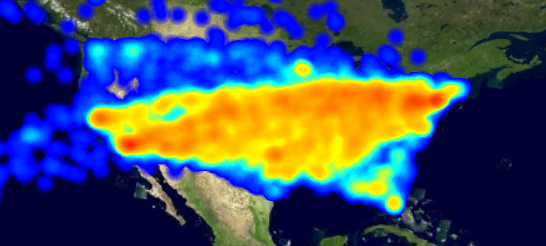
LuciadRIA maps support hardware-accelerated density maps, often called heat maps. A density map counts overlapping features on each pixel and colors the pixels according to the amount of overlap.
You can use heat maps for any data:
-
Icons, lines, and areas
-
Dynamic data and static data
You enable it using the density property on any FeaturePainter.
You have to pass a ColorMap that maps the amount of overlapping features to colors.
const painter = new FeaturePainter();
// painter.paintBody = ... // customize painter as usual
painter.density = {
  //Use the factory method from the ColorMap module to create a gradient color map
  colorMap: createGradientColorMap([
    {level: 0, color: "rgba(  0,   0,   0, 0.0)"}, //        no objects -> Transparent
    {level: 1, color: "rgba(  0, 255,   0, 0.5)"}, //  1 opaque object  -> Transparent blue
    {level: 10, color: "rgba(255, 255, 255, 1.0)"}  // 10 opaque objects -> White
  ])
};
Note that when you are using density painting, the regular color of features isn’t relevant. The alpha transparency value indicates the weight of the feature as a value between 0 and 1.
If you want to use density for icons, don’t specify an icon image.
Instead, LuciadRIA automatically uses a gradient icon. You can re-size it using the IconStyle width and height properties.
See the API documentation of FeaturePainter.density for more details, and see the Tracks sample for an example.