LuciadRIA supports OGC SLD/SE styling and filtering functions out-of-the-box. On top of those, LuciadRIA pre-defines a range of custom styling and filtering functions. If you still need more functionality in addition to the pre-defined functions, you can plug in your own custom functions.
This article elaborates on the usage and the expected outcome of the pre-defined functions. It also shows you how to plug in your own functions.
Using the pre-defined functions
You can make use of these pre-defined custom functions:
-
vertices: a geometry function that returns all points of a geometry. -
startPoint: a geometry function that returns the first point of a geometry. -
endPoint: a geometry function that returns the last point of a geometry. -
startAngle: a geometry function that returns the angle of the line starting at the start point of the geometry. -
endAngle: a geometry function that returns the angle of the line ending at the end point of the geometry. -
Recode: a transformation function that transforms a set of discrete attribute values into another set of values. -
Categorize: a transformation function that transforms a continuous-valued attribute into a set of discrete values. -
Interpolate: a transformation function that transforms a continuous-valued attribute into another continuous range of values. -
strTrim: a text-altering function that returns a copy of the string with leading and trailing blank spaces omitted. -
dateFormat: a text-altering function that returns a formatted date string.
Vertices
You can use the vertices function to add styling to the vertices of your feature geometry. You either replace the styling you already defined on the
geometry itself, or you add the styling on top of that styling. The function has a single parameter: the name of the feature
property that points to the geometry of which you want to style the individual vertices. No matter if you provide this parameter
or not, LuciadRIA always chooses the feature geometry itself to fetch vertices from.
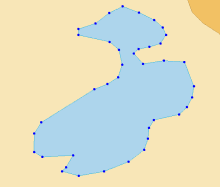
Expand for the code that creates the image above:
<?xml version='1.0' encoding='UTF-8'?>
<FeatureTypeStyle xmlns="http://www.opengis.net/se" xmlns:ogc="http://www.opengis.net/ogc" version="1.1.0">
  <Rule>
    <PolygonSymbolizer>
      <Fill>
        <SvgParameter name="fill">#add5ec</SvgParameter>
      </Fill>
      <Stroke>
        <SvgParameter name="stroke">#17afe0</SvgParameter>
      </Stroke>
    </PolygonSymbolizer>
    <PointSymbolizer>
      <Geometry>
        <!-- The geometry on which we want to apply this point symbolizer styling = the vertices of the base geometry -->
        <ogc:Function name="vertices">
          <ogc:PropertyName>the_geom</ogc:PropertyName>
        </ogc:Function>
      </Geometry>
      <Graphic>
        <Mark>
          <WellKnownName>circle</WellKnownName>
          <Fill>
            <SvgParameter name="fill">#0000FF</SvgParameter>
          </Fill>
        </Mark>
        <Size>8</Size>
      </Graphic>
    </PointSymbolizer>
  </Rule>
</FeatureTypeStyle>
StartPoint and startAngle, endPoint and endAngle
You can use the startPoint or endPoint function to add styling to the first or last vertex of your feature geometry.
You either replace the styling you already defined on the geometry itself, or you add the styling on top of that styling.
The function has a single parameter: the name of the feature property that points to the geometry of which you want to style
the individual vertices.
No matter if you provide this parameter or not, LuciadRIA always chooses the feature geometry itself to fetch vertices from.
The startPoint or endPoint function can be combined with the startAngle and endAngle function to add a custom correctly rotated arrow at the start or end of a line.
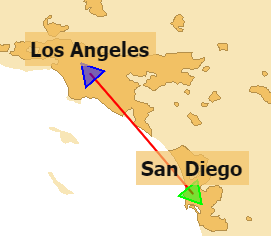
Expand for the code that creates the image above:
<?xml version='1.0' encoding='UTF-8'?>
<FeatureTypeStyle xmlns="http://www.opengis.net/se"
                  xmlns:ogc="http://www.opengis.net/ogc"
                  xmlns:xsi="http://www.w3.org/2001/XMLSchema-instance"
                  xsi:schemaLocation="http://www.opengis.net/ogc
                   http://schemas.opengis.net/filter/1.1.0/filter.xsd
                   http://www.opengis.net/se
                   http://schemas.opengis.net/se/1.1.0/FeatureStyle.xsd"
                  version="1.1.0">
  <Description>
    <Title>San Diego To Los Angeles</Title>
  </Description>
  <Rule>
    <LineSymbolizer>
      <Description>The line connecting San Diego and Los Angeles</Description>
      <Stroke>
        <SvgParameter name="stroke">#FF0000</SvgParameter>
        <SvgParameter name="stroke-width">2</SvgParameter>
      </Stroke>
    </LineSymbolizer>
    <PointSymbolizer>
      <Description>A green arrow in San Diego</Description>
      <Geometry>
        <ogc:Function name="startPoint">
          <ogc:PropertyName>the_geom</ogc:PropertyName>
        </ogc:Function>
      </Geometry>
      <Graphic>
        <Mark>
          <WellKnownName>triangle</WellKnownName>
          <Fill>
            <SvgParameter name="fill">#00FF00</SvgParameter>
            <SvgParameter name="fill-opacity">0.5</SvgParameter>
          </Fill>
          <Stroke>
            <SvgParameter name="stroke">#00FF00</SvgParameter>
            <SvgParameter name="stroke-width">2</SvgParameter>
          </Stroke>
        </Mark>
        <Size>30</Size>
        <Rotation>
          <ogc:Function name="startAngle">
            <ogc:PropertyName>the_geom</ogc:PropertyName>
          </ogc:Function>
        </Rotation>
      </Graphic>
    </PointSymbolizer>
    <PointSymbolizer>
      <Description>A blue arrow in Los Angeles</Description>
      <Geometry>
        <ogc:Function name="endPoint">
          <ogc:PropertyName>the_geom</ogc:PropertyName>
        </ogc:Function>
      </Geometry>
      <Graphic>
        <Mark>
          <WellKnownName>triangle</WellKnownName>
          <Fill>
            <SvgParameter name="fill">#0000FF</SvgParameter>
            <SvgParameter name="fill-opacity">0.5</SvgParameter>
          </Fill>
          <Stroke>
            <SvgParameter name="stroke">#0000FF</SvgParameter>
            <SvgParameter name="stroke-width">2</SvgParameter>
          </Stroke>
        </Mark>
        <Size>30</Size>
        <Rotation>
          <ogc:Function name="endAngle">
            <ogc:PropertyName>the_geom</ogc:PropertyName>
          </ogc:Function>
        </Rotation>
      </Graphic>
    </PointSymbolizer>

  </Rule>
</FeatureTypeStyle>
Recode
You can use the Recode function to apply specific styling based on a certain feature property that varies discretely. The parameters you need for
this function are the property that diversifies the styling, followed by the value pairs that map each property value to the
applicable styling.
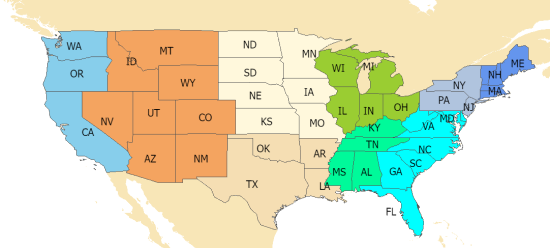
Expand for the code that creates the image above:
<?xml version='1.0' encoding='UTF-8'?>
<FeatureTypeStyle xmlns="http://www.opengis.net/se" xmlns:ogc="http://www.opengis.net/ogc" version="1.1.0">
  <Description>
    <Title>States</Title>
  </Description>
  <Rule>
    <PolygonSymbolizer>
      <Stroke>
        <SvgParameter name="stroke">#555555</SvgParameter>
      </Stroke>
      <Fill>
        <SvgParameter name="fill">
          <!-- Fill color based on sub_region using recode -->
          <ogc:Function name="Recode">
            <!-- Value to transform -->
            <ogc:Function name="strTrim">
              <ogc:PropertyName>SUB_REGION</ogc:PropertyName>
            </ogc:Function>

            <!-- Map of input to output values -->
            <ogc:Literal>N Eng</ogc:Literal>
            <ogc:Literal>#6495ED</ogc:Literal>

            <ogc:Literal>Mid Atl</ogc:Literal>
            <ogc:Literal>#B0C4DE</ogc:Literal>

            <ogc:Literal>S Atl</ogc:Literal>
            <ogc:Literal>#00FFFF</ogc:Literal>

            <ogc:Literal>E N Cen</ogc:Literal>
            <ogc:Literal>#9ACD32</ogc:Literal>

            <ogc:Literal>E S Cen</ogc:Literal>
            <ogc:Literal>#00FA9A</ogc:Literal>

            <ogc:Literal>W N Cen</ogc:Literal>
            <ogc:Literal>#FFF8DC</ogc:Literal>

            <ogc:Literal>W S Cen</ogc:Literal>
            <ogc:Literal>#F5DEB3</ogc:Literal>

            <ogc:Literal>Mtn</ogc:Literal>
            <ogc:Literal>#F4A460</ogc:Literal>

            <ogc:Literal>Pacific</ogc:Literal>
            <ogc:Literal>#87CEEB</ogc:Literal>
          </ogc:Function>
        </SvgParameter>
      </Fill>
    </PolygonSymbolizer>
    <TextSymbolizer>
      <Label>
        <ogc:PropertyName>STATE_ABBR</ogc:PropertyName>
      </Label>
      <LabelPlacement>
        <PointPlacement></PointPlacement>
      </LabelPlacement>
      <Font>
        <SvgParameter name="font-family">Tahoma</SvgParameter>
        <SvgParameter name="font-size">20</SvgParameter>
      </Font>
    </TextSymbolizer>
  </Rule>
</FeatureTypeStyle>
Categorize
The Categorize function allows you to apply specific styling based on a certain feature property that varies continuously. The parameters
you need for this function are the property that diversifies the styling, followed by the value pairs that map threshold values
to the applicable styling for that value range.
Expand for the code that creates the image above:
<?xml version='1.0' encoding='UTF-8'?>
<FeatureTypeStyle xmlns="http://www.opengis.net/se" xmlns:ogc="http://www.opengis.net/ogc" version="1.1.0">
<Description>
<Title>States</Title>
</Description>
<Rule>
<PolygonSymbolizer>
<Stroke>
<SvgParameter name="stroke">#555555</SvgParameter>
</Stroke>
<Fill>
<SvgParameter name="fill">
<ogc:Function name="Categorize">
<!-- Value to transform -->
<ogc:Div>
<ogc:PropertyName>POP1996</ogc:PropertyName>
<ogc:PropertyName>AREA</ogc:PropertyName>
</ogc:Div>
<!-- Output values and thresholds -->
<ogc:Literal>#87CEEB</ogc:Literal>
<ogc:Literal>20</ogc:Literal>
<ogc:Literal>#FFFACD</ogc:Literal>
<ogc:Literal>100</ogc:Literal>
<ogc:Literal>#F08080</ogc:Literal>
</ogc:Function>
</SvgParameter>
</Fill>
</PolygonSymbolizer>
<TextSymbolizer>
<Label>
<ogc:PropertyName>STATE_ABBR</ogc:PropertyName>
</Label>
<LabelPlacement>
<PointPlacement></PointPlacement>
</LabelPlacement>
<Font>
<SvgParameter name="font-family">Tahoma</SvgParameter>
<SvgParameter name="font-size">20</SvgParameter>
</Font>
</TextSymbolizer>
</Rule>
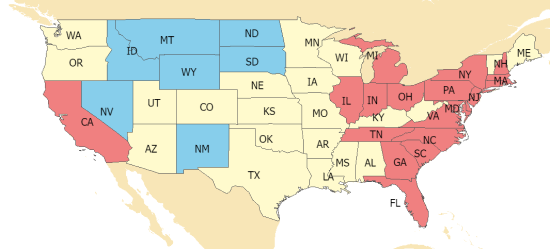
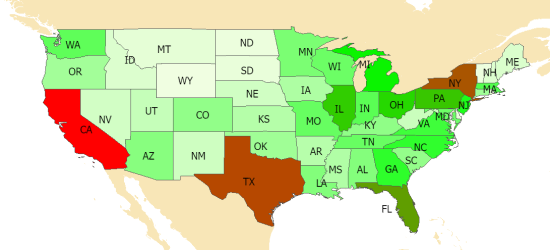
</FeatureTypeStyle>Interpolate
With the Interpolate function, you can interpolate colors or numbers based on a feature property. For its parameters, you provide the property
and assign discrete color or number values to specific property values on the range. These discrete color or number values
will be interpolated for property values in between the defining property values.
|
The
|
Expand for the code that creates the image above:
<?xml version='1.0' encoding='UTF-8'?>
<FeatureTypeStyle xmlns="http://www.opengis.net/se" xmlns:ogc="http://www.opengis.net/ogc" version="1.1.0">
  <Description>
    <Title>States</Title>
  </Description>
  <Rule>
    <PolygonSymbolizer>
      <Stroke>
        <SvgParameter name="stroke">#555555</SvgParameter>
      </Stroke>
      <Fill>
        <SvgParameter name="fill">
          <ogc:Function name="Interpolate">
            <!-- Property to transform -->
            <ogc:PropertyName>POP1996</ogc:PropertyName>

            <!-- Mapping curve definition pairs (input, output) -->
            <ogc:Literal>0</ogc:Literal>
            <ogc:Literal>#fefeee</ogc:Literal>

            <ogc:Literal>9000000</ogc:Literal>
            <ogc:Literal>#00ff00</ogc:Literal>

            <ogc:Literal>23000000</ogc:Literal>
            <ogc:Literal>#ff0000</ogc:Literal>

            <!-- Interpolation method - color or numeric - defaults to color -->
            <ogc:Literal>color</ogc:Literal>

            <!-- Interpolation mode - only linear is implemented - defaults to linear -->
            <ogc:Literal>linear</ogc:Literal>
          </ogc:Function>
        </SvgParameter>
      </Fill>
    </PolygonSymbolizer>
    <TextSymbolizer>
      <Label>
        <ogc:PropertyName>STATE_ABBR</ogc:PropertyName>
      </Label>
      <LabelPlacement>
        <PointPlacement></PointPlacement>
      </LabelPlacement>
      <Font>
        <SvgParameter name="font-family">Tahoma</SvgParameter>
        <SvgParameter name="font-size">20</SvgParameter>
      </Font>
    </TextSymbolizer>
  </Rule>
</FeatureTypeStyle>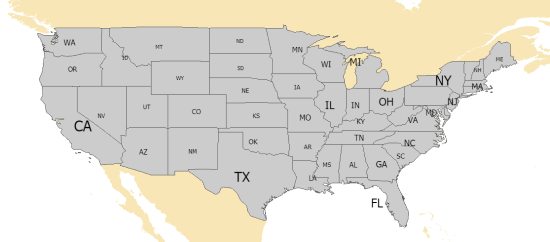
Expand for the code that creates the image above:
<?xml version='1.0' encoding='UTF-8'?>
<FeatureTypeStyle xmlns="http://www.opengis.net/se" xmlns:ogc="http://www.opengis.net/ogc" version="1.1.0">
  <Description>
    <Title>States</Title>
  </Description>
  <Rule>
    <PolygonSymbolizer>
      <Stroke>
        <SvgParameter name="stroke">#555555</SvgParameter>
      </Stroke>
      <Fill>
        <SvgParameter name="fill">#cccccc</SvgParameter>
      </Fill>
    </PolygonSymbolizer>
    <TextSymbolizer>
      <Label>
        <ogc:PropertyName>STATE_ABBR</ogc:PropertyName>
      </Label>
      <LabelPlacement>
        <PointPlacement></PointPlacement>
      </LabelPlacement>
      <Font>
        <SvgParameter name="font-family">Tahoma</SvgParameter>
        <SvgParameter name="font-size">
          <ogc:Function name="Interpolate">
            <!-- Property to transform -->
            <ogc:PropertyName>POP1996</ogc:PropertyName>

            <!-- Mapping curve definition pairs (input, output) -->
            <ogc:Literal>0</ogc:Literal>
            <ogc:Literal>10</ogc:Literal>

            <ogc:Literal>9000000</ogc:Literal>
            <ogc:Literal>20</ogc:Literal>

            <ogc:Literal>23000000</ogc:Literal>
            <ogc:Literal>30</ogc:Literal>

            <!-- Interpolation method -->
            <ogc:Literal>numeric</ogc:Literal>
          </ogc:Function>
        </SvgParameter>
      </Font>
    </TextSymbolizer>
  </Rule>
</FeatureTypeStyle>
dateFormat
The 'dateFormat' string formatting function formats a date according to the desired pattern. Check out the supported patterns strings in Table 1, “dateFormat patterns”. There are two ways to use the date formatting functionality. You can use the custom function Program: 'dateFormat', but you can also use the specific Symbology Encoding date formatting function Program: 'FormatDate'.
<Label>
  <Function name="dateFormat">
    <ogc:Literal>dd-MMMit-yyyy</ogc:Literal>
    <ogc:PropertyName>DATE</ogc:PropertyName>
  </Function>
</Label><Label>
<FormatDate>
<DateValue>
<ogc:PropertyName>DATE</ogc:PropertyName>
</DateValue>
<Pattern>DD-M-YYYY - hh:mm a</Pattern>
</FormatDate>
</Label>| Pattern string | Meaning |
|---|---|
|
YYYY |
Four digit year |
|
YY |
Two-digit year (without century and millennium) |
|
MM |
Two-digit month |
|
M |
Month, leading zero omitted |
|
MMM |
Month displayed by three letter acronym (“FEB”), ISO 639 two-letter language codes as defined by ISO 639 can be appended to create language-dependent variants (MMMde would yield “DEZ” instead of “DEC”) |
|
MMMMM |
for display of full month (“February”). The two-letter language code can be appended (MMMMMde would result in ‘Februar’). |
|
DD |
Two-digit day |
|
D |
Day, leading zero omitted |
|
hh |
hour, h is used to omit a leading zero |
|
mm |
minute, m is used to omit a leading zero |
|
ss |
second, s is used to omit a leading zero |
|
a |
am/pm marker |
|
. |
point, will appear literally in the result |
|
/ |
slash, literally |
|
: |
colon. literally |
|
- |
minus, literally |
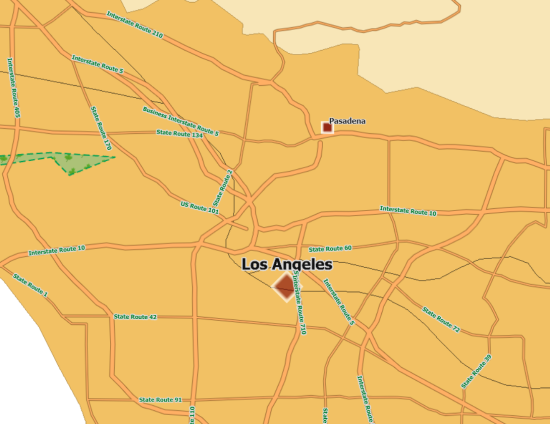
Adding custom functions
You can add your own functions as functionEvaluators in the SEPainterCreateOptions. You must define your custom functions with a unique name. They can have any number of literals or feature properties as
arguments. You define those arguments in the SLD definition when you’re using your custom functions. You can even use nested
functions, as illustrated by the sample.
We implemented an example in the SymbologyEncoding sample, where roads now get a width depending on their name. The road names in the sample data convey the road type because
they typically contain interstate, state or us.
|
You could accomplish exactly the same capability through the pre-defined |
First, you create your SEPainter with an extra option functionEvaluators.
Program: Providing custom functions for road styling demonstrates how to provide the custom functions needed to style the roads based on their type.
samples/symbologyencoding/SampleLayer.ts)
painter = await createPainterFromString(seSource, {
  strict: true,
  functionEvaluators: roadFunctionEvaluators,
});
Program: Creating custom functions for road styling demonstrates how to create the custom functions needed to style the roads based on their type.
samples/symbologyencoding/RoadCustomStyling.ts)
export const roadFunctionEvaluators: { [name: string]: FunctionEvaluator<string | number | null | Shape | boolean> } = {
  "roadOuterWidthByName": (name: string): number => {
    if(!name) {
      return 3;
    }
    if (name.indexOf("Interstate Route") > -1) {
      return 8;
    } else if (name.indexOf("US Route") > -1) {
      return 6;
    } else if (name.indexOf("State Route") > -1) {
      return 4;
    } else {
      return 0;
    }
  },
  "roadInnerWidthFromOuterWidth": (outerWidth: number): number => {
    return outerWidth - 2;
  },
}
Second, you adapt your SLD file to use these functions to determine the stroke widths of your roads instead of providing the widths as a fixed number.
Program: Using custom functions for road styling demonstrates how to use the custom functions to style the roads based on their type in the SLD file. You can see that the
roadOuterWidthByName function uses the parameter ogc:PropertyName NAME as an argument. It also shows that the second function, roadInnerWidthFromOuterWidth, uses the nested function roadInnerWidthByName as its argument.
<?xml version='1.0' encoding='UTF-8'?>
<FeatureTypeStyle xmlns="http://www.opengis.net/se" xmlns:ogc="http://www.opengis.net/ogc" version="1.1.0">
  <Description>
    <Title>US roads</Title>
  </Description>
  <Rule>
    <MinScaleDenominator>6.0E5</MinScaleDenominator>
    <MaxScaleDenominator>5.0E6</MaxScaleDenominator>
    <LineSymbolizer>
      <Stroke>
        <SvgParameter name="stroke">#93622a</SvgParameter>
        <SvgParameter name="stroke-width">
          <ogc:Function name="roadOuterWidthByName">
            <ogc:PropertyName>NAME</ogc:PropertyName>
          </ogc:Function>
        </SvgParameter>
      </Stroke>
    </LineSymbolizer>
    <LineSymbolizer>
      <Stroke>
        <SvgParameter name="stroke">#ffaf64</SvgParameter>
        <SvgParameter name="stroke-width">
          <ogc:Function name="roadInnerWidthFromOuterWidth">
            <ogc:Function name="roadOuterWidthByName">
              <ogc:PropertyName>NAME</ogc:PropertyName>
            </ogc:Function>
          </ogc:Function>
        </SvgParameter>
      </Stroke>
    </LineSymbolizer>
  </Rule>
</FeatureTypeStyle>
You can provide any property of the feature you want to your function for styling:
-
Providing feature properties: In code, you fetch a regular feature property with
feature.property["property_name"]. In your SLD definition, you pass it along correctly as<ogc:PropertyName>property_name</ogc:PropertyName>. -
Providing a feature ID: In code, you fetch the ID of your feature with
feature.id. In your SLD definition, you pass it along correctly as<ogc:PropertyName>id</ogc:PropertyName>. -
Providing a feature shape: In code, you fetch the shape of your feature with
feature.shapeor withfeature.geometry. In your SLD definition, you pass it along correctly as<ogc:PropertyName>the_geom</ogc:PropertyName>or<ogc:PropertyName>GEOMETRY</ogc:PropertyName>.